Voyant for Text Analysis
Summary
Demonstrates a number of ways to use Voyant to analyze text.
Overview
Getting Started:
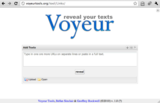
There are 4 ways to load a corpus:
1.) type/paste the text into the text area or provide a set of URLs (one per line.)
2.) click the upload button to choose one or more files from your computer.
3.) open an existing (pre-defined) corpus (these are intended as examples)
4.) using the Voyant API
Tools:
Bubblelines: Visualizes the frequency of the repetition of different words throughout the document(s). Document are represented as a horizontal line divided into different segments. Word frequencies are represented as bubbles on the line and the bigger the bubble the more the word is used in the document. More information can be found here.
Bubbles: Represents the relative frequency of words in a corpus through a cloud of bubbles. Bubble represents a word, and the bigger the bubble, the more the word is used in the corpus. More information can be found here.
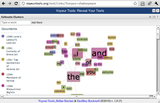
Cirrus: Word cloud representing the frequency of words in a corpus, the bigger the word, the more it appears throughout the corpus. More information can be found here.
Corpus Grid: Gives an overview of a corpus, showing each document's title, total number of words, number of unique words (word types), and lexical density (the ratio of tokens to types). More information can be found here.
Corpus Summary: Provides a simple, textual overview of the corpus. Including the number of words, number of unique words, longest and shortest documents, highest and lowest vocabulary density, most frequent words, etc. More information can be found here.
Corpus Type Frequencies Grid: Provides an ordered list for all the words' frequencies appearing in a corpus. Additional columns can be toggled to show statistical data such as a line graph for term frequency over the corpus. More information can be found here.
Document Input Add: Allows the user to dynamically add additional documents to a corpus after importing the initial documents. More information can be found here.
Document Type Collocate Frequencies Grid: Provides an ordered list of word collocation for a specified word and document. More information here.
Document Type Frequencies Grid: Provides an ordered list of word frequencies along with other statistical data for each document within the corpus. More information can be found here.
Document Type KWIC's Grid: Displays a table contextualizing a selected word with the phrases or paragraphs of texts that directly precede and follow each instances of the word throughout the corpus. More information can be found here.
Knots: Represents the corpus as a series of twists. Each line depicts the a selected term over the length of the corpus. The extent of the lines overlapping represent the level of correspondance they have with each other. More information can be found here.
Lava: Displays multiple layers of the corpus in a 3D model, selecting a document expands the Lava graph into a ring allowing you to explore the terms in their context. More information can be found here.
Links: Represents the collocation of the terms in a corpus by depicting them in a network using a force directed graph, the relative size of the term represents its frequency. More information can be found here.
Mandala: Allows importing of textual files to execute evaluations on the frequency and linkage of terms. More information can be found here.
Reader: Provides a viewing window that allows the user to read the full text of the corpus they have imported into their corpus. More information can be found here.
RezoViz: Visualizes the relationships between people, locations, and organizations in a collection of documents. Links are made between pairs of people, locations, and organizations within each document. More information can be found here.
ScatterPlot: Displays the correspondance of the word use in the corpus. This tool relies on a statistical analysis that takes the word's correspondance from each document, each document is represented as a dimesion, and this layout reduces it to a 3D space to visual the data as a scatterplot graph. More information can be found here.
Terometer: Depicts the change of word frequency across a corpus over time. Similar to the TermsRadio tool, the temporal dimension of this tool is not expanded across the x-axis, instead it is spread across the y-axis. More information can be found here.
TermsRadio: Provides a scrolling line graph that can depict the change of the frequency of word across a corpus over time. More information can be found here.
Type Frequencies Chart: Displays a line graph depicting the distribution of a word’s occurrence across a corpus. More information can be found here.
Word Count Fountain: Visualizes word frequencies as a fountain. Each stream represents a unique word, where its height represents frequency the term occurred in the corpus. More information can be found here.
Exporting a Corpus:
While using Voyant you have the ability to bookmark and share URLs that refer to your collection of texts. Among other advantages, this allows you to work with the same texts during different sessions, without having to reload all the documents each time. You can export a link for the entire skin by clicking on the “Export” (diskette) icon in the blue bar at the top, or export a link for an individual tool by clicking on the “Export” icon in one of the tool panes.
There are 4 ways to load a corpus:
1.) type/paste the text into the text area or provide a set of URLs (one per line.)
2.) click the upload button to choose one or more files from your computer.
3.) open an existing (pre-defined) corpus (these are intended as examples)
4.) using the Voyant API
Tools:
Bubblelines: Visualizes the frequency of the repetition of different words throughout the document(s). Document are represented as a horizontal line divided into different segments. Word frequencies are represented as bubbles on the line and the bigger the bubble the more the word is used in the document. More information can be found here.
Bubbles: Represents the relative frequency of words in a corpus through a cloud of bubbles. Bubble represents a word, and the bigger the bubble, the more the word is used in the corpus. More information can be found here.
Cirrus: Word cloud representing the frequency of words in a corpus, the bigger the word, the more it appears throughout the corpus. More information can be found here.
Corpus Grid: Gives an overview of a corpus, showing each document's title, total number of words, number of unique words (word types), and lexical density (the ratio of tokens to types). More information can be found here.
Corpus Summary: Provides a simple, textual overview of the corpus. Including the number of words, number of unique words, longest and shortest documents, highest and lowest vocabulary density, most frequent words, etc. More information can be found here.
Corpus Type Frequencies Grid: Provides an ordered list for all the words' frequencies appearing in a corpus. Additional columns can be toggled to show statistical data such as a line graph for term frequency over the corpus. More information can be found here.
Document Input Add: Allows the user to dynamically add additional documents to a corpus after importing the initial documents. More information can be found here.
Document Type Collocate Frequencies Grid: Provides an ordered list of word collocation for a specified word and document. More information here.
Document Type Frequencies Grid: Provides an ordered list of word frequencies along with other statistical data for each document within the corpus. More information can be found here.
Document Type KWIC's Grid: Displays a table contextualizing a selected word with the phrases or paragraphs of texts that directly precede and follow each instances of the word throughout the corpus. More information can be found here.
Knots: Represents the corpus as a series of twists. Each line depicts the a selected term over the length of the corpus. The extent of the lines overlapping represent the level of correspondance they have with each other. More information can be found here.
Lava: Displays multiple layers of the corpus in a 3D model, selecting a document expands the Lava graph into a ring allowing you to explore the terms in their context. More information can be found here.
Links: Represents the collocation of the terms in a corpus by depicting them in a network using a force directed graph, the relative size of the term represents its frequency. More information can be found here.
Mandala: Allows importing of textual files to execute evaluations on the frequency and linkage of terms. More information can be found here.
Reader: Provides a viewing window that allows the user to read the full text of the corpus they have imported into their corpus. More information can be found here.
RezoViz: Visualizes the relationships between people, locations, and organizations in a collection of documents. Links are made between pairs of people, locations, and organizations within each document. More information can be found here.
ScatterPlot: Displays the correspondance of the word use in the corpus. This tool relies on a statistical analysis that takes the word's correspondance from each document, each document is represented as a dimesion, and this layout reduces it to a 3D space to visual the data as a scatterplot graph. More information can be found here.
Terometer: Depicts the change of word frequency across a corpus over time. Similar to the TermsRadio tool, the temporal dimension of this tool is not expanded across the x-axis, instead it is spread across the y-axis. More information can be found here.
TermsRadio: Provides a scrolling line graph that can depict the change of the frequency of word across a corpus over time. More information can be found here.
Type Frequencies Chart: Displays a line graph depicting the distribution of a word’s occurrence across a corpus. More information can be found here.
Word Count Fountain: Visualizes word frequencies as a fountain. Each stream represents a unique word, where its height represents frequency the term occurred in the corpus. More information can be found here.
Exporting a Corpus:
While using Voyant you have the ability to bookmark and share URLs that refer to your collection of texts. Among other advantages, this allows you to work with the same texts during different sessions, without having to reload all the documents each time. You can export a link for the entire skin by clicking on the “Export” (diskette) icon in the blue bar at the top, or export a link for an individual tool by clicking on the “Export” icon in one of the tool panes.