Network Analysis
Summary
Represent data as a set of nodes and edges between them.Overview
Network analysis involves representing data as a graph (or network) and then analyzing that graph using standard analyses. A graph is a set of nodes (or verticies) and relationships between those nodes called edges. Edges between nodes can be directed (one way) or undirected (two way).
Both nodes and edges may be weighted, e.g., to signify importance.
Here's an example of a simple graph with six nodes and edges between some of them:

(Credit: Wikimedia)
A more involved example of a graph is a social network of Twitter users wherein nodes are the users and edges between nodes are established based on whether a user replies to or mentions another user in a tweet:
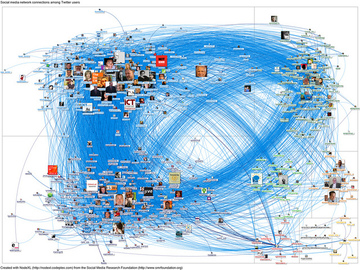
(Credit: https://www.flickr.com/photos/marc_smith/6871711979)
Once data is represented as a graph, a number of standard analyses can be applied. Popular graph analyses include:
More details of these can be found on this Wolfram Alpha page.
Here's an example of a simple graph with six nodes and edges between some of them:
(Credit: Wikimedia)
A more involved example of a graph is a social network of Twitter users wherein nodes are the users and edges between nodes are established based on whether a user replies to or mentions another user in a tweet:
(Credit: https://www.flickr.com/photos/marc_smith/6871711979)
Once data is represented as a graph, a number of standard analyses can be applied. Popular graph analyses include:
- centrality measures (how important are different nodes and edges in the graph)
- distance measures (how many "hops" does it take to get from one node to another)
- degree (how many connections go into and out of a node)
- reciprocity (in a directed graph, how many relationships are two way)
More details of these can be found on this Wolfram Alpha page.